A Survey of America’s Educators
Voices from the Classroom 2025 does what President Trump and his Administration have not: It asks teachers what they think. Do they embrace or reject Trump’s education agenda? And, at this pivotal moment in American history, what is their vision for the future of K-12 public education?
We find that teachers across regions, school types, and even political backgrounds firmly and wholeheartedly reject President Trump’s education agenda. Despite this, they are optimistic about the future of education. Their satisfaction with the profession is slowly increasing, but stands at odds with how they describe it: It’s not sustainable, dynamic, or collaborative. Ultimately, teachers remain deeply committed to reimagining public education through strategies such as artificial intelligence, innovative staffing approaches, and high-quality instructional materials, rather than to President Trump’s efforts to dismantle it.
Major Trends and Findings
THEME ONE

Teachers reject the Trump administration’s education agenda across the board: Between 70% and 92% oppose each of the administration’s education priorities included in the poll
THEME TWO

Teachers see public schools as key to helping students understand civic responsibilities, identify and counter misinformation, and engage in respectful debate about differences in opinion.
THEME THREE

Despite the widespread use of effective tools for addressing chronic absenteeism and building strong relationships with families, two-thirds of teachers report that students’ absences continue to have a very serious impact on learning.
THEME FOUR

Teachers’ outlook on the profession has slowly improved over the past few years, and most report being satisfied with their jobs. Still, many seek change—only 19% would recommend the profession to others—and they’re open to strategic staffing as an avenue for achieving it.
THEME FIVE

Teachers are increasingly likely to say that their districts effectively support them in implementing high-quality materials and that these materials have impacted their instruction. However, many still seek additional resources external to the curriculum, highlighting a need for more training to ensure all students can access the curriculum.
THEME SIX

The percentage of teachers who believe artificial intelligence could transform teaching and learning has doubled in the past year, yet many remain concerned about inadequate training, potential distractions from learning, and risks of misuse
Take Action
Tell the Secretary of Education: Do Your Job! Ask your member of Congress to protect the Department of Education and demand that Secretary Linda McMahon to do her job!
Gen-Z Voices from the Classroom
Voices from the Classroom 2025 includes an oversample of 300 Gen Z teachers — those born in 1997 or later — in addition to a nationally representative survey of 1,000 teachers. As newer teachers — who began their careers after COVID-19 — they are statistically most likely to exit the profession. Taking note of how their outlook differs from elder peers offers insight into the values and struggles of the next generation of teachers, and how to retain them.

Methodology
The Voices from the Classroom 2025 survey questionnaire was developed by 17 Educators for Excellence teacher members from across the United States. The instrument was written and administered by Penta Group Intelligence, an independent research firm, and conducted online from December 18, 2024 through February 3, 2025, among a nationally representative sample of 1,000 full-time public-school teachers. Note that all survey results are presented as percentages and, due to rounding, may not always add up to 100 percent.
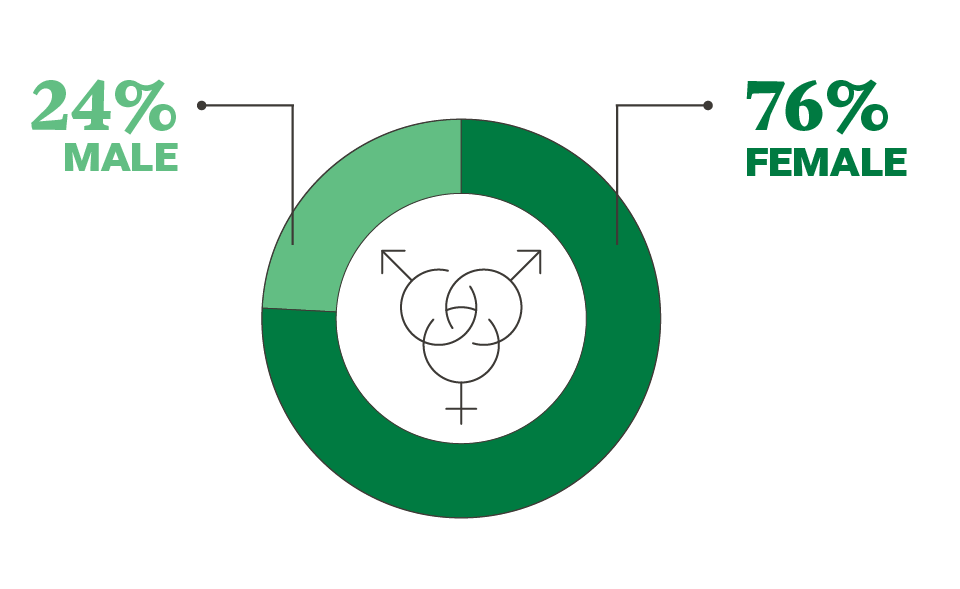
Gender
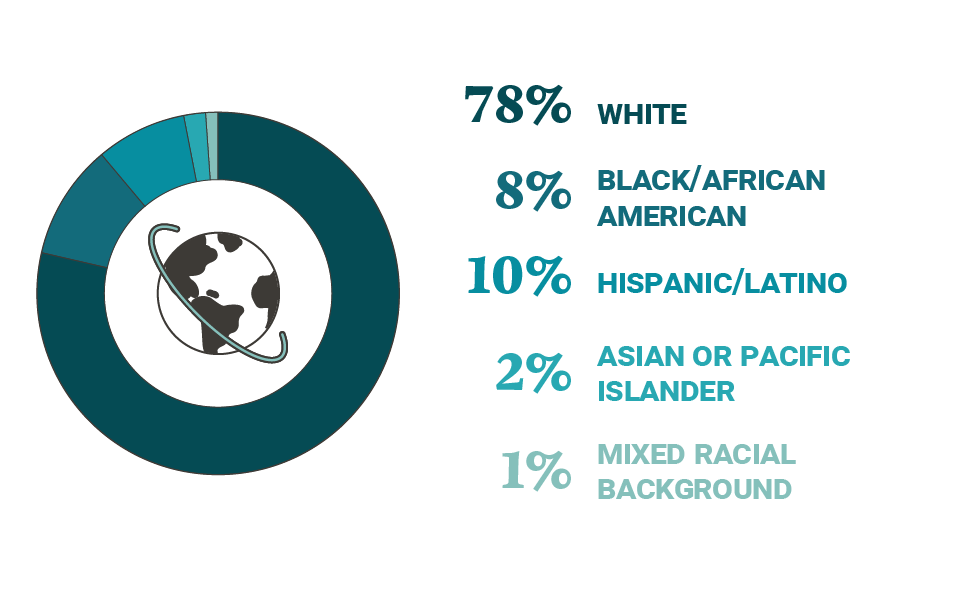
Race/Ethnicity
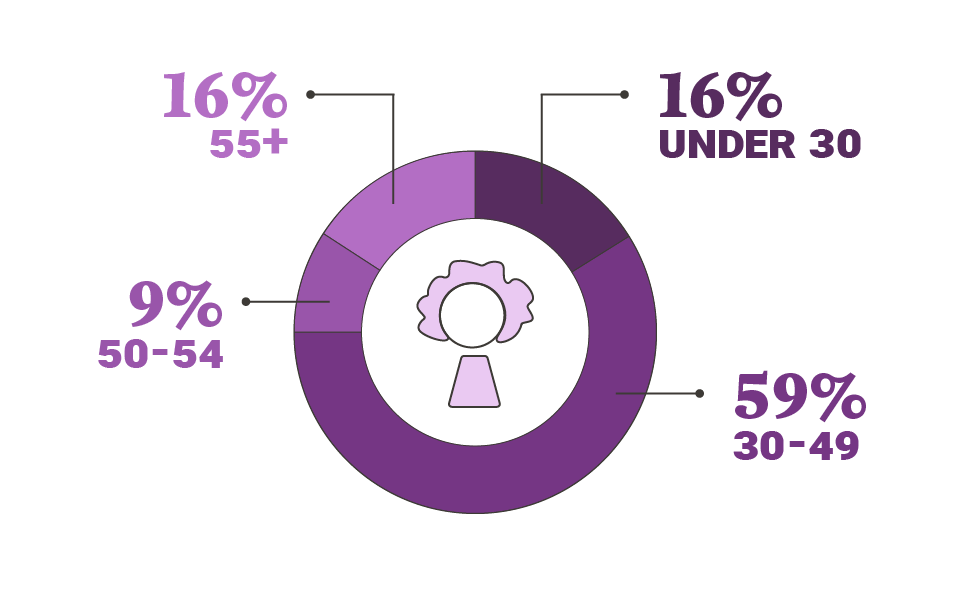
Age
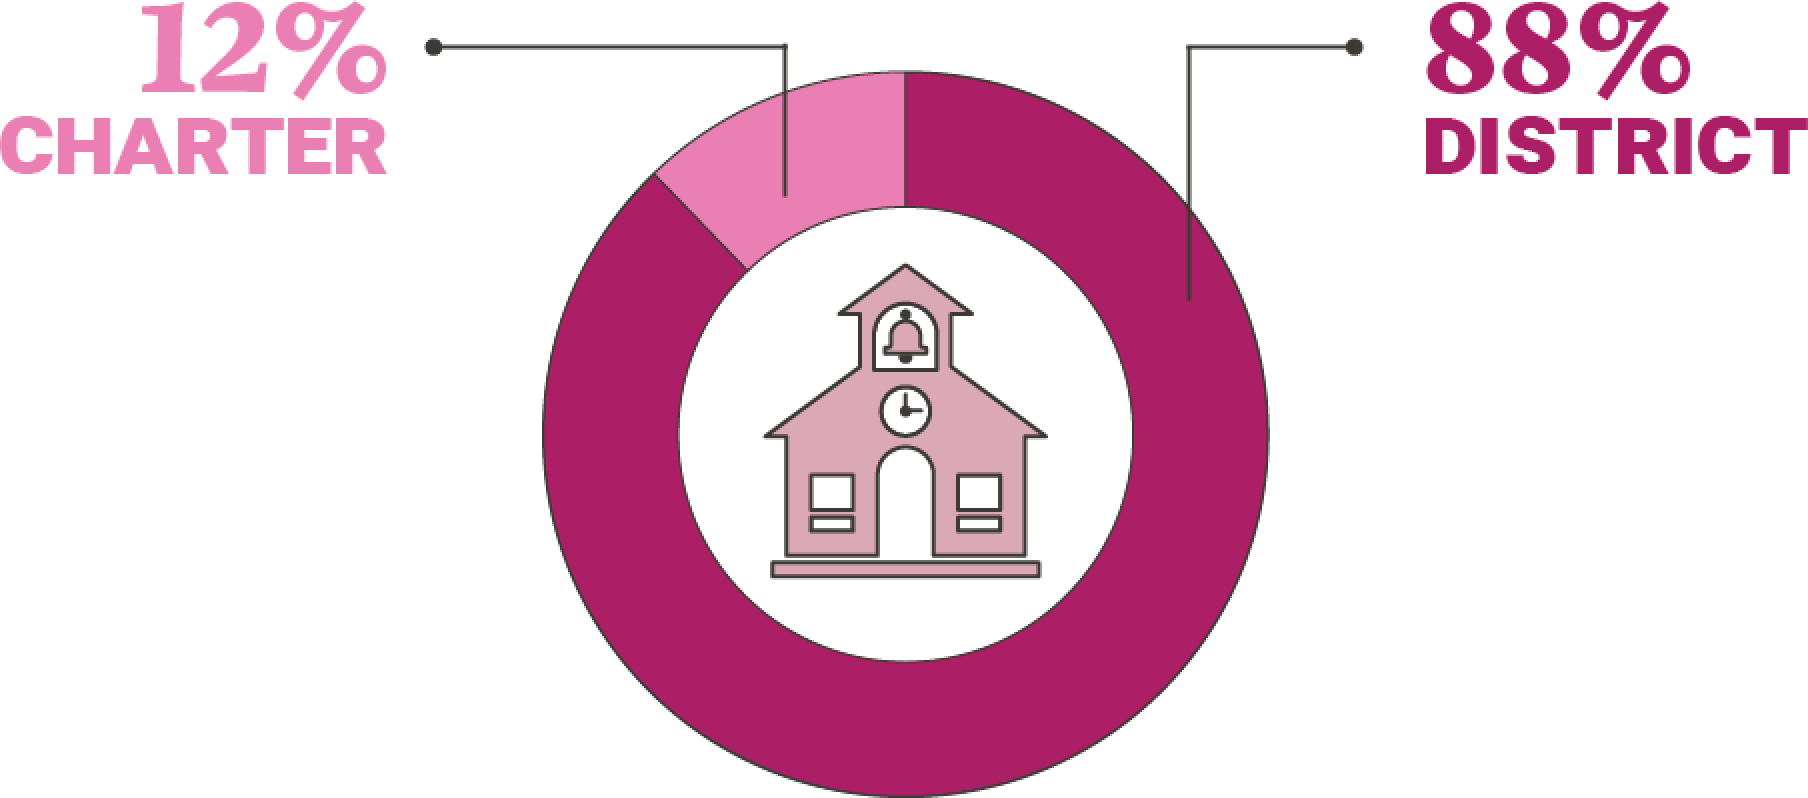
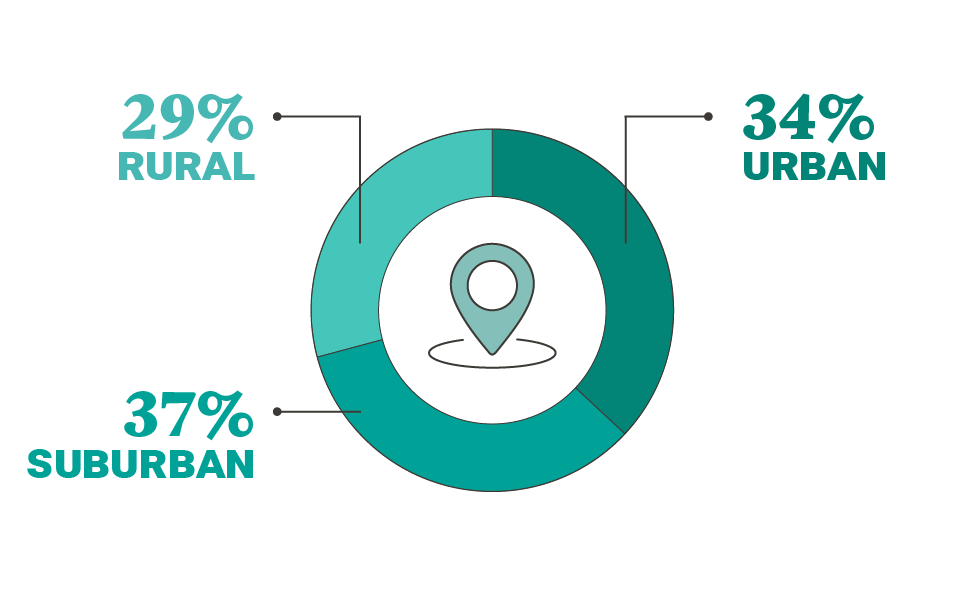
School Type
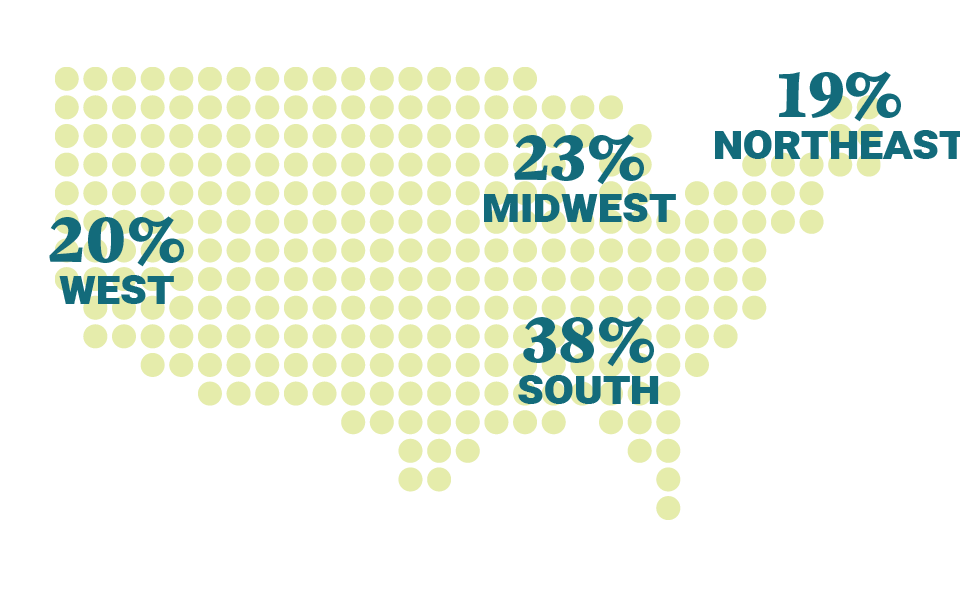
Region